Wednesday, April 19, 2006
Cost of Going to a game
The Fan Cost Index, Now in its 14th year, it tracks what a typical family of 4 might purchase at a game, tracks the cost, provides the for the trip to the ballgame, and the percentage of increase or decrease from the year prior.
What makes up the FCI? Here’s how it’s broken down:
Two (2) adult average-price tickets
Two (2) child average-price tickets
Two (2) small draft beers
Four (4) small soft drink
Four (4) regular-size hot dogs
Parking for one (1) car,
Two (2) game programs
Two (2) least expensive, adult-size adustable caps.
So, average ticket prices have gone up League-wide by 5.36%, and when the food drink, parking, programs, tickets, and hats come into play, the average went up 4.13% for from the year prior.
Here’s the highs and the lows for those bringing the family to the ballpark this season.
Where will I pay the highest average ticket price? Boston’s Fenway Park. Average ticket price $46.46. FCI is 287.84, an increase of 4.20% from the year prior.
Where’s the least expensive average ticket? Average ticket price $13.71. Kansas City’s Kauffman Stadium. FCI is 120.35.
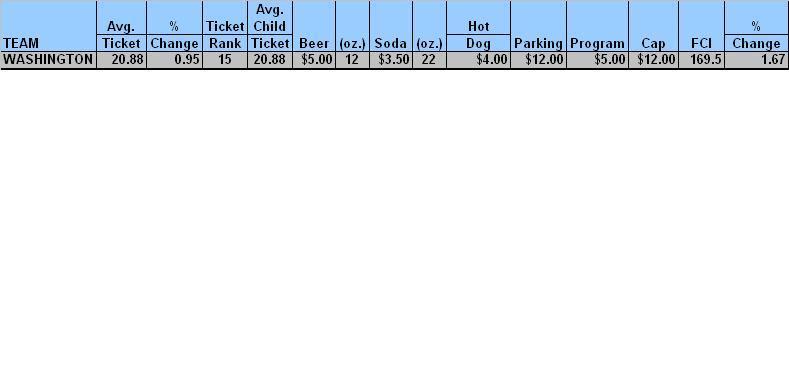
RFK Stadium average ticket price, 20.88, FCI is $169.5
It is very interesting to see that the Nationals, while below the league average, are still higher than playoff caliber teams (Oakland, Cleveland, Florida, Atlanta, Arizona, and Angels) and other brand new ballparks: Cinci, Milwaukee. We should not have to pay the prices that we are paying for a old, outdated stadium, terrible concessions, no owner, a terrible GM, and sub-par players.
Subscribe to:
Post Comments (Atom)
No comments:
Post a Comment